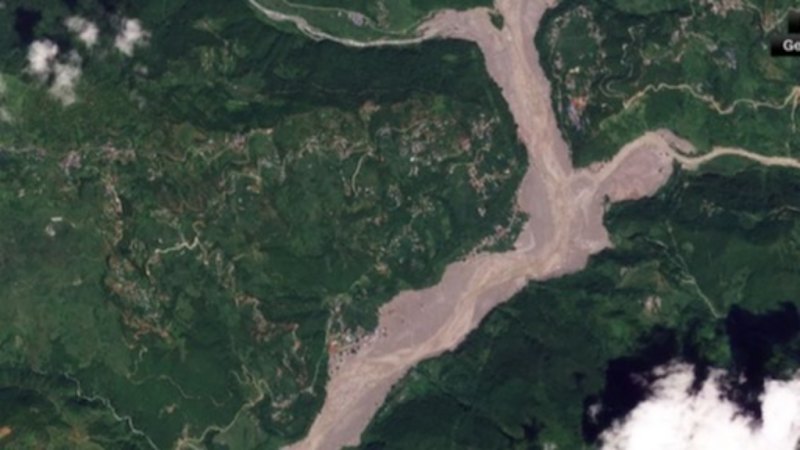
Visual documentation of flash floods relies on spatial comparisons that capture systemic failures in water management long after the water recedes. Standard media reporting typically focuses on the immediate human toll and the localized destruction of property, failing to analyze the underlying hydrological and structural mechanics that transform a meteorological event into a catastrophic failure of the built environment. Aerial imagery and before-and-after mapping serve as diagnostic instruments rather than mere illustrations, exposing how pre-existing urban design choices dictate the vector and velocity of disaster.
Understanding the true cost of extreme precipitation requires examining the intersection of meteorology, topography, and civil engineering. When torrential rain overwhelms drainage capacity, the resulting destruction follows predictable rules dictated by surface permeability, elevation gradients, and the placement of critical infrastructure.
The Hydrological Deficit Of Modern Surface Design
The primary driver of severe urban flooding is not merely the volume of rainfall, but the rate of runoff generated by impervious surfaces. Natural landscapes absorb precipitation through soil matrixes and vegetation, moderating the speed at which water reaches natural watercourses. Urban environments replace this porous substrate with asphalt, concrete, and tightly packed real estate.
When rainfall intensity exceeds the infiltration capacity of the soil—or when soil is entirely absent—precipitation converts instantly into surface runoff.
Rainfall Intensity > Infiltration Capacity = Exponential Surface Runoff
This conversion strips away the natural time buffer between a meteorological event and a hydrological response. In a natural basin, water accumulates gradually over hours. In a heavily urbanized watershed, runoff concentrates within minutes. Drainage infrastructure installed decades ago was engineered around historical precipitation frequency curves that no longer align with current weather patterns. Engineers typically design storm sewers to handle specific return periods, such as a ten-year or fifty-year storm event. When the statistical probability of these events increases due to shifting climatic conditions, the drainage network operates under chronic structural deficit.
The physical mechanics of this deficit manifest in specific ways during a flash flood:
- Pipe capacity saturation forces backflow through manhole covers and street inlets.
- Subterranean utility corridors act as secondary channels, routing water into basements and transit tunnels.
- Narrowed natural channels and concrete-lined riverbeds accelerate flow velocity, transforming urban streets into high-energy torrents capable of moving vehicles and tearing up infrastructure.
Spatial Topography As A Determinant Of Risk
Before-and-after maps consistently demonstrate that flood damage is not randomly distributed across a municipality. Topography dictates the flow paths, and urban geography dictates the obstacles that impede or accelerate that flow. Water follows gravity along the path of least resistance, which in cities often corresponds to street grids, railway cuts, and historical stream beds that were paved over and forgotten.
Depressions in the urban landscape—such as underpasses, low-lying intersections, and subterranean parking structures—act as natural catchment basins. When the volume of runoff exceeds the transport capacity of the street network, these low points accumulate standing water rapidly. A depth of only two feet of moving water can displace a passenger vehicle, while four feet can exert enough hydrostatic pressure to collapse exterior foundation walls.
Urban density compounds this vulnerability through the funnel effect. Tall buildings create narrow corridors where wind-driven rain concentrates, and street canyons restrict the lateral dispersion of water. As floodwaters rise, the spatial arrangement of buildings determines whether water moves in a manageable sheet flow or concentrates into destructive, high-velocity jets.
Mapping these zones reveals that socio-economic factors frequently correlate with infrastructure investment disparities. Older industrial districts and low-income neighborhoods historically received lower allocations for subterranean drainage upgrades, leaving them disproportionately exposed to surface accumulation.
The Failure Modes Of Emergency Infrastructure
When mapping software overlays pre-disaster conditions with post-disaster destruction, it reveals critical failure points in the resilience of municipal lifelines. Power grids, potable water systems, and transportation networks do not fail in isolation; they experience cascading failures triggered by inundation.
Substation flooding is a primary catalyst for systemic municipal collapse. When a low-lying electrical substation is submerged, operators must cut power to prevent catastrophic equipment destruction and electrocution hazards. This loss of power immediately disables traffic signaling, pumping stations, and communication towers across a wide radius.
Without functional pumping stations, areas that rely on mechanical drainage remain flooded long after the rain has stopped. The intersection of water and electricity creates compounding hazards that delay emergency response and extend recovery timelines.
Transportation corridors suffer a dual failure mode during flash floods. Initially, they become impassable due to water depth and debris accumulation. Post-disaster imagery subsequently reveals structural undermining, where the high-velocity flow of water erodes the sub-base beneath asphalt and rail lines, causing catastrophic collapses days after the water level drops. This sub-surface scouring is often invisible from the surface until a heavy vehicle crosses the compromised section, making post-flood transit assessment a complex engineering challenge.
Diagnostic Value Of Comparative Spatial Data
The transition from qualitative disaster accounts to quantitative spatial analysis allows civil planners to move past reactive disaster management. Comparing pre-event topography with post-event destruction vectors provides an empirical foundation for future infrastructure spending.
Traditional disaster assessment relied on insurance claims and visual surveys, which capture economic loss but miss the underlying spatial mechanics. High-resolution before-and-after mapping captures the exact trajectory of water, the points of initial overflow, and the structural thresholds where buildings transition from habitable to compromised.
This data feeds directly into hydraulic modeling software, enabling engineers to simulate extreme weather scenarios with high fidelity. By identifying where existing infrastructure bottlenecks caused water to back up, municipalities can target retention basin construction, permeable pavement retrofits, and zoning restrictions in high-risk zones.
Addressing the escalating frequency of flash flooding requires shifting capital allocation from post-disaster remediation to pre-emptive structural hardening. Municipalities must abandon static historical baselines in favor of dynamic hydrological modeling that accounts for accelerated surface runoff and altered precipitation intensity. The objective of spatial mapping is not merely to document destruction after the fact, but to establish a predictive framework that eliminates the structural vulnerabilities responsible for that destruction in the first place.