The stability of the Consumer Price Index (CPI) at 2.4% in February 2026 represents a deceptive equilibrium rather than a cooling economy. While top-line inflation figures suggest a plateau, the underlying mechanics indicate a transition from demand-pull inflation to cost-push volatility. The February data captures the final window of domestic fiscal cooling before the supply-side shocks associated with the escalation of conflict involving Iran began to permeate global energy and insurance markets. Understanding this transition requires a granular breakdown of the lag between geopolitical events and their manifestation in domestic retail prices.
The Three Pillars of February Price Stability
The 2.4% print was sustained by a specific alignment of domestic factors that temporarily offset rising global tensions. This "dead zone" in inflationary movement is defined by three primary variables:
- Inventory Lag and Retail Buffering: Large-scale retailers entered Q1 2026 with inventories procured during the late 2025 period of relative maritime stability. The retail sector absorbed minor wholesale increases in February to maintain market share, creating a temporary disconnect between rising producer costs and consumer prices.
- The Cooling of Service-Sector Wage Growth: Labor market tightening slowed in the early weeks of the year. As the "Great Reshuffle" of the mid-2020s reached saturation, the velocity of wage-push inflation in the service sector moderated, providing a heavy anchor against the rising cost of goods.
- Housing Index Deceleration: The shelter component of the CPI, which often lags behind real-time market shifts by six to twelve months, finally reflected the high-interest-rate environment of 2025. This downward pressure served as the primary counterweight to the volatile energy sub-index.
The Energy Transmission Mechanism
The primary failure in standard inflation reporting is the assumption that fuel prices at the pump are the sole indicator of energy-driven inflation. In reality, the "war effect" operates through a multi-stage transmission mechanism that began its acceleration in late February.
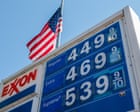
The first stage is the Direct Energy Cost. Crude oil futures reacted instantaneously to the geopolitical instability in the Middle East, yet the impact on the February CPI was muted because of the Strategic Petroleum Reserve (SPR) release schedules and existing refinery contracts.
The second stage is the Logistic Risk Premium. This is the more insidious driver of the 2.4% "floor." As shipping lanes in the Persian Gulf faced heightened threat profiles, maritime insurance premiums increased by orders of magnitude. These costs do not show up at the pump; they manifest in the landed cost of every imported intermediate good—from petrochemicals used in plastics to fertilizers used in industrial agriculture.
The third stage is the Expectation Feedback Loop. When manufacturers anticipate a prolonged supply disruption, they pivot from "Just-in-Time" to "Just-in-Case" procurement. This hoarding behavior artificially inflates demand for commodities, driving prices up before the actual physical shortage occurs. The February data reflects the very beginning of this pivot.
The Cost Function of Modern Conflict
The escalation involving Iran introduces a non-linear variable into the inflation equation. Standard economic models struggle with this because it is not a simple supply reduction; it is a fundamental shift in the global risk architecture. The cost function of this conflict can be categorized by its impact on the "Triple Constraint" of global trade:
- Insurance and Indemnity: The cost of insuring a Suez-bound or Gulf-bound vessel has moved from a negligible operational expense to a primary cost driver. For some carriers, insurance now represents 10-15% of the total voyage cost.
- Route Diversion Latency: Circumventing high-risk zones adds 10 to 14 days to standard transit times. This effectively reduces the global shipping capacity by roughly 20%, as the same number of vessels can complete fewer trips per annum. This "synthetic scarcity" drives up freight rates even if demand remains stagnant.
- Energy Intensity of Transit: Longer routes require more bunker fuel. At a time when crude prices are spiking due to the conflict itself, the shipping industry is hit by a double-primary: more fuel consumed at a higher price per unit.
Quantifying the Lag: Why February is a Leading Indicator
To assess the true state of the economy, one must distinguish between "Sticky Prices" and "Flexible Prices."
Flexible Prices, such as fuel and fresh produce, reacted within days of the initial hostilities. However, Sticky Prices, such as rents, insurance contracts, and multi-year supply agreements, held the February figure at 2.4%. The divergence between these two categories is currently at its widest point in three years.
This creates a "Pressure Cooker Effect." The headline 2.4% figure creates a false sense of security for monetary policy, while the Producer Price Index (PPI)—which leads the CPI by three to six months—has already begun to drift upward. The delta between PPI and CPI is currently being absorbed by corporate profit margins. This absorption has a finite limit. Once margins are compressed to 2023 levels, corporations will be forced to pass the "War Premium" directly to the consumer.
The Liquidity Trap and Interest Rate Paradox
The central bank faces a structural bottleneck. Conventional wisdom suggests that if inflation rises due to war-related supply shocks, rates should stay high or increase. However, the energy-driven nature of this inflation acts as a "natural tax" on consumers, reducing discretionary spending.
Raising rates into a supply-side shock risks a "Stability-Instability Paradox." By attempting to crush demand to meet a restricted supply, the central bank may inadvertently collapse the productive capacity of the economy, making the eventual recovery more inflationary as supply chains must be rebuilt from scratch.
Strategic Rebalancing for an Inflationary Pivot
The 2.4% plateau is a statistical mirage. Decision-makers must look past the headline figure and prepare for a re-acceleration of costs driven by the "War on Iran" risk premium. The following structural shifts are now mandatory for maintaining capital efficiency:
- Transition from Nominal to Real Asset Allocation: In an environment where cost-push inflation is driven by energy and logistics, nominal bonds offer negative real yields. Capital must be rotated into "Commodity-Adjacent" equities—companies that own the means of extraction or the infrastructure of logistics, rather than those that merely consume them.
- Supply Chain Localization as a Hedge: The "Efficiency Era" of globalized, low-cost logistics is over. The cost-benefit analysis now favors higher-cost domestic production over lower-cost international production that carries a high "Geopolitical Beta."
- Dynamic Pricing Integration: Fixed-price contracts are a liability in a 2026 economy. Organizations must integrate real-time energy and freight indices into their client agreements to prevent margin erosion as the February "calm" evaporates.
The 2.4% February inflation print will likely be viewed by history as the final moment of the "Post-Pandemic Normal" before the "Conflict-Driven Reality" took hold. The strategic play is to front-run the inevitable PPI-to-CPI pass-through by securing long-term energy hedges and reducing exposure to long-tail international logistics. The window for low-cost hedging is closing as the physical effects of the Middle Eastern escalation move from the futures market to the supermarket.